Bone Health: The Number Your Doctor Isn’t Telling You About:
The Hidden DEXA Score That Changes Everything
A week ago I went through the usual bi-annual ritual: A DEXA scan reading to track my bone health.
The results? Truly puzzling.
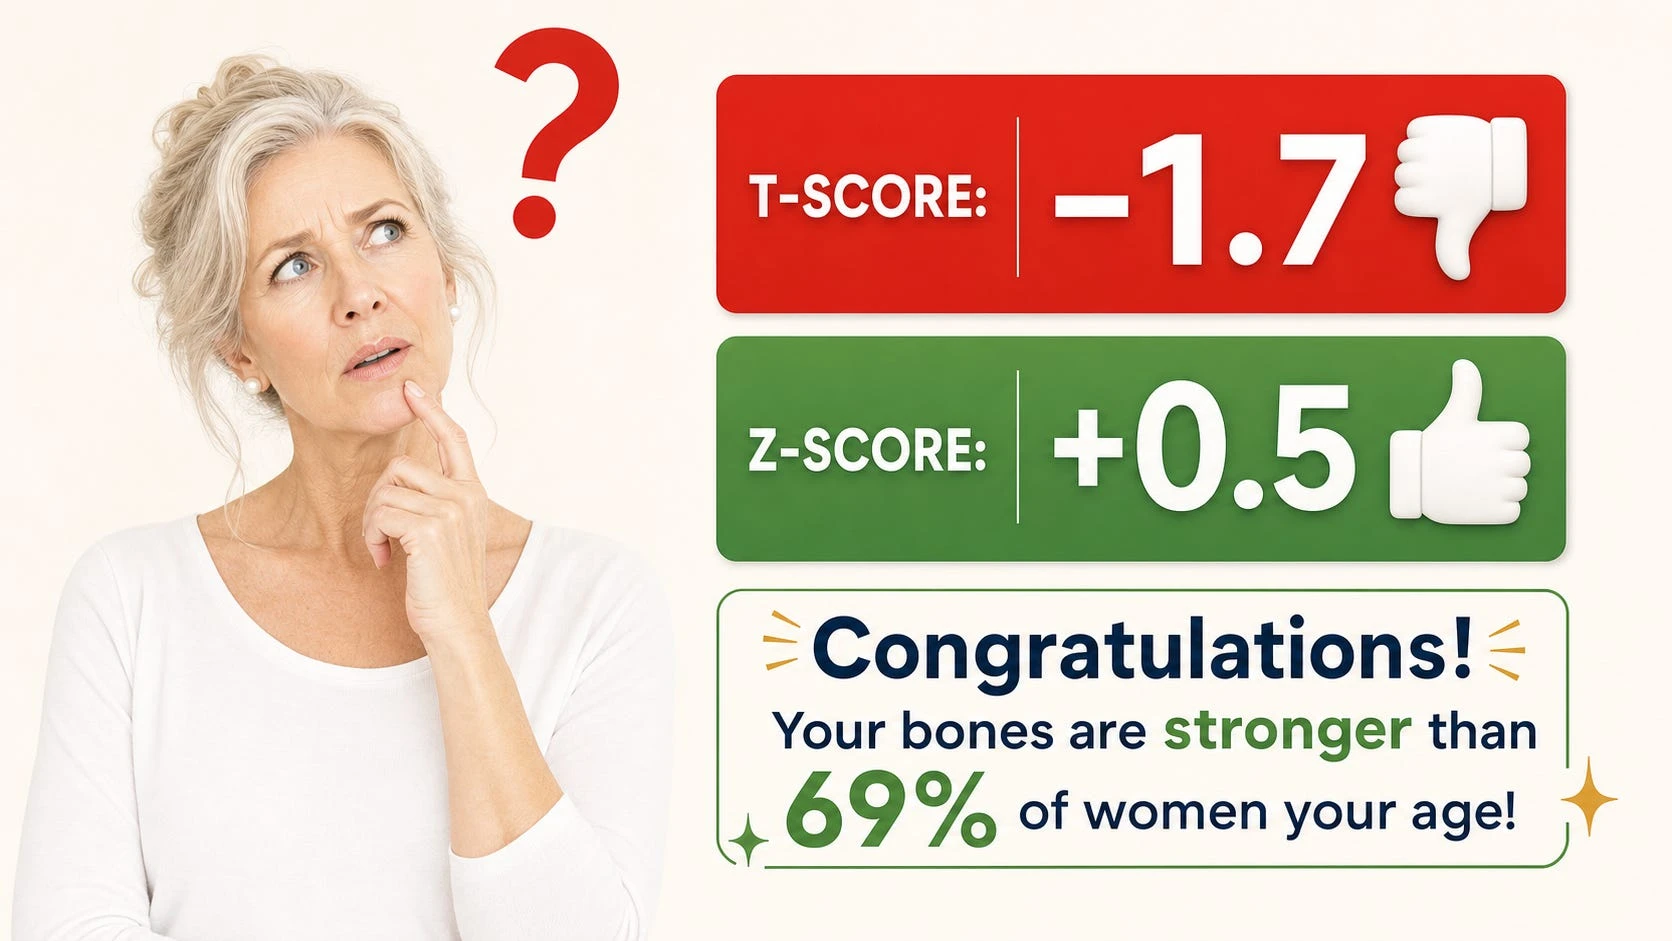
My right femoral neck T-score: −1.7. So, osteopenia, trending toward osteoporosis. Pretty much unchanged from two years ago. My lumbar spine told a similar story.
But this time there were a different set of numbers on the report.
My Z-scores. Right femoral neck Z-score: +0.5. Left femoral neck Z-score: +0.4.
Holy guacamole…
A Z-score of +0.5 means my bone density is better than approximately 69% of women my own age.
I’ll take that one, any day.
So, let me get this straight: The T-score says my bone health is bad and I’m trending toward osteoporosis. My Z-score says I have better bones than 69% of women my age.
Both numbers are sitting on the same piece of paper. Both are technically correct. Only one of them — the alarming one — typically gets explained.
This is not a minor footnote in bone health.
It is, I would argue, one of the most consequential miscommunications in women’s medicine today.
Two Scores — Two Totally Different Questions
Think of it this way. Imagine you’re 66 years old and you run a mile in 12 minutes. Is that fast or slow?
Well, it depends on who you compare yourself to.
If you compare yourself to a 30-year-old Olympic runner, it looks slow. But if you compare yourself to other 66-year-old women who run, it might actually be pretty fast!
That’s exactly what’s happening with these two bone scores.
The T-score compares your bones to a healthy 30-year-old woman at the absolute peak of her bone strength. A T-score of −1.0 means your bones are one step below that peak. A T-score of −1.7 means they’re a bit further below it — enough to get the label “osteopenia.”
The Z-score compares your bones to women your own age. It asks a completely different question: For a woman your age, how are your bones doing?
A Z-score above zero means your bones are better than average for your age group. A Z-score of +0.5 — like mine — means better than roughly 69% of women my age.¹¹
My bone loss is real. But it is less than what most women my age have experienced.
These are not two ways of saying the same thing. They are answers to two completely different questions. And yet, in most doctor’s visits, only the T-score gets discussed.
This has had huge negative consequences for millions of women over the past 30 years.
Where Did “Osteopenia” Even Come From?
Here’s something most people don’t know: the words “osteopenia” and “osteoporosis” — as medical diagnoses — are actually pretty new. They were invented at a single World Health Organization (WHO) meeting in 1992, and officially published in 1994.¹
Before that meeting, there was no standard definition for osteoporosis. The WHO group created one, based on how your bones compare to a young adult woman: normal meant a T-score above −1.0; osteopenia fell between −1.0 and −2.5; osteoporosis was −2.5 and below.¹
Here is what’s rarely mentioned: the WHO report itself said these numbers were meant for studying large groups of people — not for diagnosing individual patients or deciding who needs medication.¹
In fact, the way the cutoff numbers were chosen was a bit like this: researchers decided what percentage of women they thought had bone problems — and then drew the line to match. Later critics called this choice essentially arbitrary — a line drawn to fit an expected number, not because the science showed that a T-score of exactly −2.5 was some important biological cliff.¹ ⁷
A widely recognized principle in the field puts it plainly: T-scores were developed for estimating the prevalence of osteoporosis across populations, not for assessing osteoporosis in specific patients.
This is a distinction the original WHO report acknowledges — but it got largely lost in real-world medical practice.
But once the numbers were set, they quickly took on a life of their own.
The Problem Built Right Into the T-Score
Here’s the tricky part. The T-score compares every woman — at every age — to the average peak bone mass of a 30-year-old.
Since peak bone mass is, by definition, the highest bone density a person will ever have, and since almost everyone loses some bone after that peak, a perfectly normal postmenopausal woman will almost always have a negative T-score.
Not because something is wrong with her — but simply because she is not 30 anymore…
The numbers are striking. For white women over age 50, estimates suggest 30–50% have osteopenia by T-score criteria, and 13–18% already have osteoporosis of the hip.⁷ By age 80, more than half of women are likely to meet the T-score threshold for osteoporosis — not because their bones are dangerously fragile, but simply because they’ve aged.
Think of it this way: If you measured every adult’s eyesight against a 20-year-old’s perfect vision, most people over 50 would get the label “vision deficiency.” That doesn’t mean everyone over 50 needs major eye surgery. It just means the comparison isn’t really fair.
That’s what the T-score is doing to tens of millions of women.
When a Number Becomes a “Disease”
This is not a novel issue. Doctors and researchers have been questioning the system of osteoporosis/osteopenia diagnosis for more than 20 years.
In a well-known 2002 paper in the British Medical Journal, osteoporosis was cited as an example of “disease mongering” — the process of widening the definition of a disease to create more patients and expand markets for treatments. Researchers documented the pharmaceutical industry’s role in cementing osteopenia as a condition requiring drug treatment.
Drs. Lisa Schwartz and Steven Woloshin, two leading experts in evidence-based medicine, have documented patterns in how bone health information is presented to doctors and patients — including a tendency to emphasize relative risk reductions without disclosing absolute risks.
Their 1999 analysis using data from NHANES study showed that lowering diagnostic thresholds dramatically inflates the number of people classified as diseased and eligible for treatment — without proportionate benefit.
Here’s a concrete example of why this matters. Drug ads might say a medication “reduces fracture risk by 50%.” Sounds huge!
But if a woman’s baseline 10-year risk of hip fracture is 2%, a 50% relative reduction moves her from 2% to 1% — a one-percentage-point absolute difference. Most people, given only the relative risk figure, would feel the medication is far more powerful than it really is.
It’s also worth knowing that most of the major bisphosphonate drug trials enrolled women with T-scores of −2.0 or below, or women who had already had vertebral fractures — not the broader osteopenia population that later became a major treatment target.
One leading osteoporosis specialist, Dr. Nelson Watts, even called for eliminating the term “osteopenia” entirely, arguing it unnecessarily alarms women — including those in their 30s and 40s who simply have slightly lower-than-peak bone density.
A 30-Year Correction — From the WHO Itself
Here’s where the story gets interesting.
More than three decades after the 1992 WHO meeting that created the T-score thresholds, the International Osteoporosis Foundation (IOF) — the world’s leading global bone health organization — published a landmark Position Paper in 2025. It was endorsed by more than 85 national and global organizations.
The paper was unusually direct about the problem it was trying to solve: diagnostic criteria based solely on bone mineral density have created a system that both overtreats millions of women at low actual fracture risk and undertreats many at high risk. The paper stated plainly: ”Confusion between diagnostic and intervention thresholds is a key consideration.”
What the IOF is now formally proposing is a big shift: moving away from the T-score as a standalone treatment trigger toward individualized fracture risk assessment — one that takes into account age, prior fractures, fall history, frailty, and other health conditions like diabetes, with or without a DEXA scan.
As the IOF put it: the T-score ”should be retained as a diagnostic criterion but not necessarily as an intervention criterion.”
In other words, the same institutional family that gave us the T-score-based definition of osteopenia is now saying in print that it should not be the primary basis for deciding who gets treated.
For the millions of active, healthy women who have spent years quietly worried about a number that was always comparing them to a 30-year-old, this acknowledgment is welcome — if long overdue.
The Fracture Paradox: Most Fractures Don’t Happen in Women With Osteoporosis
This next part surprises almost everyone.
If you ask most people where the majority of osteoporotic fractures occur, they would say: in women with osteoporosis. It seems logical – after all, that’s what the DEXA t-score below -2.5 is supposed to indicate, right?
But the data tells a very different story.
One of the largest bone health studies ever done — the National Osteoporosis Risk Assessment (NORA) study, involving 149,524 postmenopausal women — found that only 6.4% of women had T-scores low enough to qualify as osteoporosis.
These women had the highest individual fracture rate. But they accounted for only 18% of all osteoporotic fractures and 26% of hip fractures. The remaining 82% of fractures happened in women with better T-scores — mostly women with osteopenia.
This sounds alarming — and unfortunately, it led many people to conclude that osteopenia also should be taken as an indicator of frature risk.
On the surface, this makes sense, until you understand what it actually means.
It is an example of what the epidemiologist Geoffrey Rose called the prevention paradox: When a risk group is large enough, it will contribute the majority of cases even if individual risk is relatively low, simply because there are so many people in the group.
If 30–50% of postmenopausal women have osteopenia, the math is straightforward: More fractures will occur in the large osteopenia pool than in the small osteoporosis pool — even though individual risk is higher in osteoporosis. This is a statement about population size, not individual danger.
Think of it like car accidents and speed. Most accidents happen at normal speeds — not because normal speeds are more dangerous than speeding, but simply because far more people drive at normal speeds.
A woman with a T-score of −1.7 and a Z-score of +0.5 who is strong, active, and has excellent balance has a fundamentally different fracture risk from the woman with the same T-score who is frail, sedentary, and has a history of falls — even though the DEXA results look identical.
Dr. Ethel Siris, the lead author of the National Osteoporosis Risk Assessment (NORA) study, concluded from her own data that reducing fractures “cannot be accomplished simply by aggressively treating women with T-scores of −2.5 or less” and called for better identification of women at truly elevated risk — which requires looking well beyond bone density.
What Actually Drives Fractures — and What DEXA Can’t See
So if the T-score isn’t the main driver of fracture risk, what is? The research is increasingly clear.
The vast majority of fractures happen after a fall
A landmark 1996 meta-analysis in the BMJ established that bone mineral density cannot identify which specific individuals will fracture — it predicts risk at the population level, but not for any given person.
Separately, researchers Wilkin and Devendra argued in 2001 that the strongest single risk factor for hip fracture is falling — not osteoporosis — and that prevention efforts should focus on older people at high fall risk regardless of their bone density.
The DEXA scan gives zero information about fall risk. A woman can have a T-score of −3.0 and excellent balance and never fracture. She can have a T-score of −1.5 with poor balance, weak legs, and dizziness from medication and be at high risk. The test cannot tell the difference.
Frailty and muscle loss
The loss of muscle mass — called sarcopenia — is independently linked to significantly higher odds of both falls and fractures, separate from bone density entirely.¹⁴ A fit, well-muscled woman with osteopenia is in a completely different situation from a frail, muscle-depleted woman with the same T-score.¹³
Type 2 diabetes
Here’s one that surprises people: individuals with type 2 diabetes fracture at higher bone mineral density values than those without diabetes. The elevated fracture risk in type 2 diabetes is largely driven by changes in bone collagen — making bones more brittle despite apparently normal density.
A 2025 narrative review by the IOF’s Bone and Diabetes Working Group confirmed that people with type 2 diabetes face significantly increased fracture risk despite normal or elevated BMD, and noted that standard fracture risk tools like FRAX may underestimate risk in diabetic patients.
Functional capacity
Grip strength, walking speed, and the ability to rise from a chair independently predict fracture risk in ways that DEXA cannot. Several large studies have found these measures to be stronger predictors of fracture outcomes in older adults than BMD alone.
Bone quality, not just quantity
DEXA measures the amount of mineral in bone — its density. It does not measure the quality of bone: the microscopic internal scaffolding, the thickness and porosity of the outer bone layer, or the collagen matrix that gives bone its flexibility and strength.
Newer tools like the REMS ultrasound scan can capture aspects of bone quality that standard BMD cannot. In a 2023 prospective study, the REMS fragility score showed that a lumbar spine fragility value above 37.2 was associated with an approximately ninefold increase in fracture risk over five years, and a hip value above 31.9 was associated with an approximately sixfold increase.
Density alone was a far weaker predictor. (Note: REMS and the fragility score are emerging tools not yet universally validated across all clinical settings.)
Back to the Z-Score: The Empowering Number You’re Not Being Shown
So what should we make of the Z-score — the number that compares you to your actual peers?
Clinically, the Z-score serves a specific purpose that the T-score cannot: it signals whether your bone loss is expected for your age, or whether something else is going on.
A Z-score below −2.0 is a clinical red flag to investigate secondary causes of bone loss — conditions like vitamin D malabsorption, celiac disease, hyperparathyroidism, thyroid disorders, certain medications, or other conditions that accelerate bone loss beyond normal aging.
This matters more than most people realize: estimates from multiple clinical series suggest that up to 30% or more of postmenopausal women with low bone mass may have an identifiable secondary contributor that, if treated, could meaningfully slow bone loss.
But the Z-score offers something else — something that clinical guidelines don’t quite capture: evidence of relative success.
A Z-score of +0.5 does not mean your bones are perfect. It does not mean you have no bone loss to be mindful of. What it means is that whatever you have been doing — how you have been moving, what you have been eating, how you have been living — your bones have aged better than most women around you.
That is not nothing. That is, in fact, exactly the information that should shape how you feel about your bone health and how you approach it going forward.
For women who practice yoga regularly, do strength training, stay active, and attend to nutrition, a positive Z-score is a form of objective feedback.
Your efforts are showing up in your biology. The T-score compares you to someone 35 years younger at the absolute peak of bone mass. The Z-score compares you to your actual peers — and in that comparison, you are doing well.
What a Complete Bone Health Conversation Looks Like
None of this is an argument for ignoring bone health. Fractures after the age of 65 — especially hip fractures — are serious. Hip fracture is associated with approximately 20–30% one-year mortality in older adults, and the loss of independence that follows a vertebral fracture cascade can be devastating. Bone health deserves serious attention.
But serious attention means accurate risk assessment, not reflexive alarm over a T-score number. A genuinely complete fracture risk picture includes:
- The T-score — for baseline bone density and longitudinal tracking over time
- The Z-score — to answer the age-appropriate question and flag whether secondary causes need investigation
- FRAX — the 10-year fracture probability calculator that incorporates age, BMI, prior fracture history, family history, smoking, alcohol use, steroid use, and rheumatoid arthritis, giving a much richer individual risk estimate⁴
- Fall risk assessment — balance tests, gait speed, chair stands, medication review
- Functional capacity — grip strength, muscle mass, functional movement
- Bone quality tools if available — REMS ultrasound, trabecular bone score (TBS), and bone turnover markers such as P1NP (bone formation) and CTX (bone resorption) blood tests, which can reflect change in as little as three months rather than the two-year wait for DEXA
The question to bring to your next appointment is not just “What is my T-score?” It is: What is my Z-score, and what does it mean for my age? What is my FRAX 10-year probability? And given my activity level, balance, and strength, what is my actual fracture risk — not just my bone density number?
The Takeaway
The next time you receive your DEXA results, look for both numbers — the T-score and the Z-score. Ask what your Z-score means. Ask what your 10-year FRAX probability is. Ask whether your bone loss is age-appropriate or whether it warrants investigation for secondary causes.
If your Z-score is positive — if you are above average for your age — let that land. It means something. It means the choices you are making about how you move, eat, and live are showing up in your biology.
Osteopenia is not a disease. It is a statistical description of where your bones sit on a curve originally designed to compare populations, not to diagnose individuals.
For most active, strong women in their 60s, the more honest summary of a T-score of −1.7 and a Z-score of +0.5 is this:
Your bones are aging. Less so than most women your age. Keep doing what you’re doing.
That is what your DEXA scan is actually telling — if your doctor bothers to tell you the full story.
Also, read...
Bone Health: The Number Your Doctor Isn’t Telling You About:
Is It Working? New Ways to Know If You Are Making a Difference
Living with Osteoporosis: The Surprising Factors That Really Drive Fracture Risk
Related courses
Join Our Age Strong Community – More Courses Coming Soon!
How Not to Be Present: Understanding the Power of Mind and Consciousness
Yoga for Flexibility: Fascia, Flow, and Metabolic Efficiency

Eva Norlyk Smith, Ph.D., C-IAYT, is the founder and President of YogaUOnline. She is a lead trainer in YogaUOnline’s Yoga Wellness Educator program, an RYT-300 Yoga Alliance-approved training that focuses on giving teachers the skills they need to offer wellness courses and work with older beginners.
Eva is a trained yoga therapist at the 1,000-hour level as well as a trained bodyworker at the 500-hour level. She is the co-author of several books, including Light Years Younger with Dr. David J. Goldberg.
References
- World Health Organization. Assessment of fracture risk and its application to screening for postmenopausal osteoporosis. WHO Technical Report Series 843. Geneva: WHO; 1994. https://apps.who.int/iris/handle/10665/39142
- Siris ES, Chen Y-T, Abbott TA, et al. Bone mineral density thresholds for pharmacological intervention to prevent fractures. Arch Intern Med. 2004;164(10):1108–1112. doi:10.1001/archinte.164.10.1108 PMID: 15159268. (NORA study: 149,524 postmenopausal women; 82% of fractures occurred in women with T-scores above −2.5) https://pubmed.ncbi.nlm.nih.gov/15159268/
- Harvey NC, Al-Daghri N, Beaudart C, et al. Barriers and solutions for global access to osteoporosis management: a Position Paper from the International Osteoporosis Foundation. Osteoporos Int. 2025;36(9):1495–1507. doi:10.1007/s00198-025-07628-5. (IOF 2025 Position Paper, endorsed by 85+ organizations, calling for “high fracture risk” as treatment/reimbursement criterion independent of T-score) https://pubmed.ncbi.nlm.nih.gov/40844608/
- Kanis JA, McCloskey EV, Johansson H, et al. Development and use of FRAX in osteoporosis. Osteoporos Int. 2010;21(suppl 2):S407–S413. doi:10.1007/s00198-010-1253-y. (FRAX fracture risk assessment tool: integrates clinical risk factors with or without BMD) https://link.springer.com/article/10.1007/s00198-010-1253-y
- Marshall D, Johnell O, Wedel H. Meta-analysis of how well measures of bone mineral density predict occurrence of osteoporotic fractures. BMJ. 1996;312(7041):1254–1259. doi:10.1136/bmj.312.7041.1254. PMID: 8634613. (BMD predicts fracture risk at population level but cannot identify individuals who will fracture) https://www.bmj.com/content/312/7041/1254
- Wilkin TJ, Devendra D. Bone densitometry is not a good predictor of hip fracture. BMJ. 2001;323(7316):795–797. PMID: 11588087. (The strongest single risk factor for hip fracture is falling, not osteoporosis; prevention should focus on infirm older people at fall risk irrespective of bone density) https://pubmed.ncbi.nlm.nih.gov/11588087/
- Ribom EL, Ljunggren O, Mallmin H. Use of a Swedish T-score reference population for women causes a two-fold increase in the amount of postmenopausal Swedish patients that fulfill the WHO criteria for osteoporosis. J Clin Densitom. 2008;11(3):404–411. PMID: 18280191. (Reference population choice roughly doubles osteoporosis prevalence without changing patients’ bones) https://pubmed.ncbi.nlm.nih.gov/18280191/
- Moynihan R, Heath I, Henry D. Selling sickness: the pharmaceutical industry and disease mongering. BMJ. 2002;324(7342):886–891. doi:10.1136/bmj.324.7342.886. (Osteoporosis cited as a leading example of corporate-influenced disease definition) https://pmc.ncbi.nlm.nih.gov/articles/PMC1122833/
- Schwartz LM, Woloshin S. Changing disease definitions: implications for disease prevalence. Analysis of the Third National Health and Nutrition Examination Survey, 1988–1994. Eff Clin Pract. 1999;2(2):76–85. PMID: 10539560. (Shifting diagnostic thresholds dramatically inflates numbers classified as diseased and eligible for treatment, without proportionate benefit; analysis used NHANES data) https://pubmed.ncbi.nlm.nih.gov/10539560/
- Schwartz LM, Woloshin S. Medical Marketing in the United States, 1997–2016. JAMA. 2019;321(1):80–96. doi:10.1001/jama.2018.19320. (Documented patterns in prescription drug and disease-awareness marketing) https://jamanetwork.com/journals/jama/fullarticle/2720029
- Lenchik L, Kiebzak GM, Blunt BA. What is the role of serial bone mineral density measurements in patient management? J Clin Densitom. 2002;5(suppl):S29–S38. PMID: 12464709. (T-score vs Z-score: clinical applications and interpretation) https://pubmed.ncbi.nlm.nih.gov/12464709/
- Harvey NC, Al-Daghri N, Beaudart C, et al. Barriers and solutions for global access to osteoporosis management (IOF Position Paper). Osteoporos Int. 2025;36(9):1495–1507. doi:10.1007/s00198-025-07628-5. (IOF endorses “high fracture risk” without obligatory DXA as treatment criterion) https://www.osteoporosis.foundation/news/closing-care-gap-iof-position-paper-identifies-barriers-and-solutions-global-undertreatment
- Dent E, Morley JE, Cruz-Jentoft AJ, et al. Physical frailty: ICFSR international clinical practice guidelines for identification and management. J Nutr Health Aging. 2019;23(9):771–787. doi:10.1007/s12603-019-1273-z. PMID: 31641726. (Frailty and sarcopenia as independent fracture risk predictors) https://pubmed.ncbi.nlm.nih.gov/31641726/
- Sepúlveda-Loyola W, Phu S, Bani Hassan E, et al. The joint occurrence of osteoporosis and sarcopenia (osteosarcopenia): definitions and characteristics. J Am Med Dir Assoc. 2020;21(2):220–225. PMID: 31669290. (Sarcopenia independently associated with elevated fracture and fall risk) https://pubmed.ncbi.nlm.nih.gov/31669290/
- Ferrari SL, et al.; IOF Bone and Diabetes Working Group. Bone microstructure and TBS in diabetes: what have we learned? A narrative review. Osteoporos Int. 2025;36(7):1115–1128. (T2DM: fractures occur at higher BMD; FRAX may underestimate risk in diabetic patients) https://www.osteoporosis.foundation/news/new-review-highlights-impact-diabetes-bone-health-and-fracture-risk-20250618-0945
- Pisani P, Renna MD, Conversano F, et al. Fragility Score: a REMS-based indicator for the prediction of incident fragility fractures at 5 years. Aging Clin Exp Res. 2023. PMC: PMC10115670. (REMS fragility score: lumbar FS >37.2 associated with ~9× fracture risk over 5 years; hip FS >31.9 associated with ~6× risk; n=1,989 enrolled. Note: REMS is an emerging tool not yet universally validated.) https://pmc.ncbi.nlm.nih.gov/articles/PMC10115670/
- Watson SL, Weeks BK, Weis LJ, Harding AT, Horan SA, Beck BR. High-intensity resistance and impact training improves bone mineral density and physical function in postmenopausal women with low bone mass: the LIFTMOR randomized controlled trial. J Bone Miner Res. 2018;33(2):211–220. doi:10.1002/jbmr.3284. PMID: 28975661. https://pubmed.ncbi.nlm.nih.gov/28975661/
- Watson SL, Weeks BK, Weis LJ, Harding AT, Horan SA, Beck BR. High-intensity exercise did not cause vertebral fractures and improves thoracic kyphosis in postmenopausal women with low to very low bone mass. Osteoporos Int. 2019;30(5):957–964. PMID: 30612163. (Zero new vertebral fractures across the LIFTMOR trial period) https://pubmed.ncbi.nlm.nih.gov/30612163/
- Rose G. Sick individuals and sick populations. Int J Epidemiol. 1985;14(1):32–38. (The prevention paradox: why most cases arise from moderate-risk populations) https://academic.oup.com/ije/article/30/3/427/736100
Note on Citation Corrections
The following corrections were made to the original article based on independent fact-checking:- Marshall meta-analysis year corrected from 1999 to 1996 (PMID 8634613). The “falls/infirm older people” argument is now correctly attributed to Wilkin & Devendra, BMJ 2001 (PMID 11588087) — a separate reference added as #6.
- Schwartz & Woloshin / NORA misattribution corrected. The NORA threshold analysis is now correctly attributed to Siris et al., Arch Intern Med. 2004 (not “JAMA Internal Medicine,” the journal’s pre-2013 name). Schwartz & Woloshin (Ref 9) are credited for their separate risk-communication scholarship using NHANES data.
- Swedish reference-population study: year corrected from 2007 to 2008, journal corrected from Osteoporosis International to J Clin Densitom (PMID 18280191).
- REMS / fragility score: now cites the primary study, Pisani et al. 2023 (PMC10115670) rather than the Conversano 2025 systematic review; participant count corrected to 1,989 enrolled; hedge added noting REMS is an emerging, not universally validated tool.
- LIFTMOR references replaced: Beck et al. 2017 ESSA position statement removed; replaced with the actual trial papers — Watson et al. J Bone Miner Res 2018 (PMID 28975661) and Watson et al. Osteoporos Int 2019 (PMID 30612163). Language about “participants with prior fractures” removed as this could not be verified as an enrollment criterion.
- Sarcopenia: reference now consistently cited as Sepúlveda-Loyola et al. JAMDA 2020 (PMID 31669290).
- “Seminars in Arthritis and Rheumatism” 2006 direct quote: unverifiable; removed. Replaced with a paraphrase anchored to the WHO’s stated epidemiological purpose.
- WHO “arbitrary” claim: reworded to attribute “arbitrary” to subsequent critics rather than presenting it as the WHO report’s own self-description.
- Hip fracture mortality: changed from “approximately 30%” to “approximately 20–30%.”
- IOF diabetes review: now cites the full paper — Ferrari SL et al., IOF Bone and Diabetes Working Group, Osteoporos Int. 2025;36(7):1115–1128 — rather than the press release.
- “45% secondary causes” figure: softened to “up to 30% or more,” consistent with StatPearls, Australian Prescriber, and Endocrine Society citations (which report 20–30% in postmenopausal women).